
User Guide
The CleanAir Model is designed to rapidly simulate PM2.5 concentrations based on emission reduction scenarios. Users can select a baseline emission inventory and meteorological fields, and then define emission reduction scenarios across multiple dimensions, including regions, sectors, and species. Based on these settings, the model simulates PM2.5 and component concentrations, which can be viewed online or downloaded by users. The specific workflow is shown in the figure below.
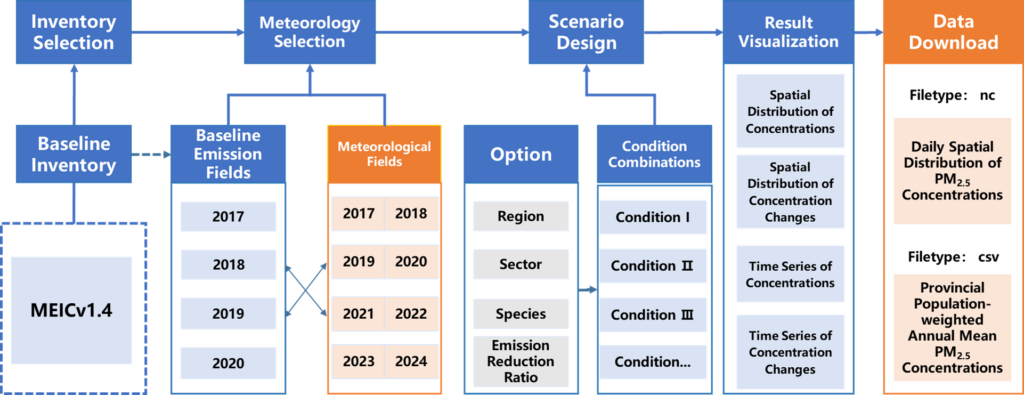
Baseline Inventory Selection:The platform includes built-in baseline emission inventories. It currently provides the 2017–2020 emission inventories from MEIC v1.4. For details, please refer to: http://meicmodel.org.cn. Users can view version information and emission data on the emission inventory page, and select the baseline inventory year when creating a new task on the online simulation page.
Meteorological Condition Selection:The platform includes meteorological field data simulated by the WRF model for 2017–2024, which are used to drive simulations by the CleanAir Model. Users can select the meteorological year when creating a new task on the simulation page.
Scenario Design:After selecting the baseline emission inventory and meteorological fields, users can set multiple emission reduction measures to form an emission reduction scenario. They can also submit emission reduction measures in batches using templates provided by the platform. For each measure, users can set emission reduction ratios from 0% to 100% for five major sectors, including power, industry, residential, transportation, and agriculture, across China’s 34 provincial-level administrative regions. The controlled species include sulfur dioxide (SO2), nitrogen oxides (NOx), primary particulate matter (PM), ammonia (NH3), and volatile organic compounds (VOCs). If conflicts exist among measures, the platform will prompt users to modify them.
Visualization:After users submit an emission reduction task, the platform calls the CleanAir Model to perform the simulation. The status of each task is displayed on the simulation task management page.
Once the simulation is completed, the platform notifies users by email. Users can click the “Result Analysis” button to view and plot PM2.5 concentration time series and spatial distribution maps online
Result Download:Users can click the “Result Download” button on the same page to download relevant data. The platform currently provides provincial- and sector-level emission data in CSV format (.csv), daily spatial distribution data of PM2.5 concentrations in NetCDF format (.nc), and provincial population-weighted annual mean concentrations of PM2.5 and its components in CSV format (.csv).
For any questions about the use of the platform, please contact:
cncap@tsinghua.edu.cn